Product · DEMO
 Try the live demo →
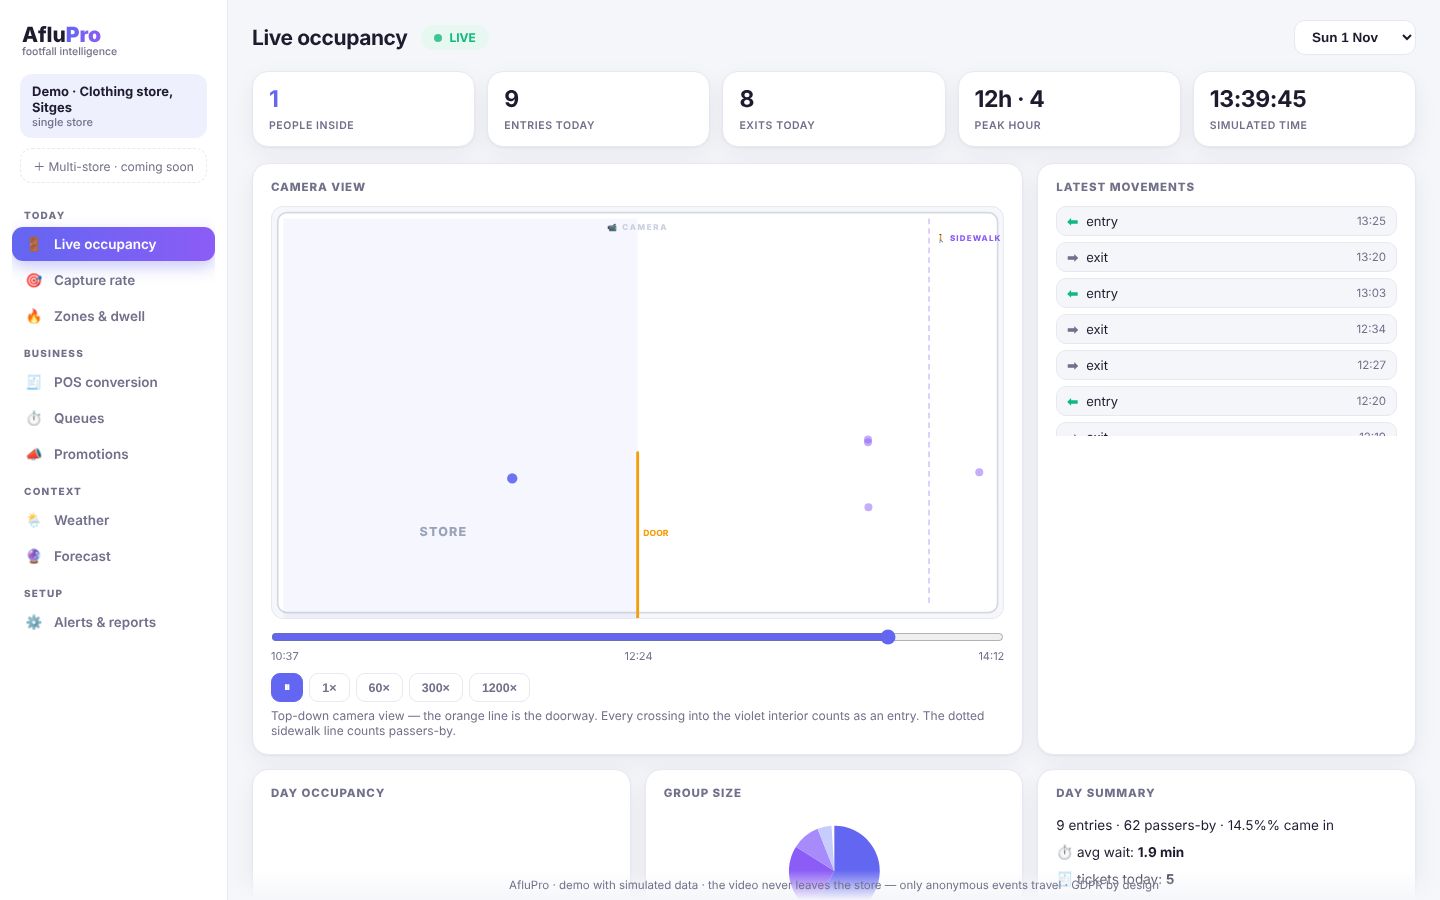
The dashboard, exactly as you'd see it every morning
Day replay, 9 modules, 4 languages. Real capture of the demo running one week of simulated data.
AfluPro turns the camera you already have into a footfall analyst: entries, occupancy, passers-by, storefront capture rate, zones, queues and tomorrow's forecast. No new cameras. No video ever leaves the shop.
on a busy street, three people can walk past for every one who comes in: that's your biggest untapped pool of customers
the till receipt — while the decision to enter happens on the sidewalk
that's what a bad day does to your traffic: without history, you never see it coming
Day replay, 9 modules, 4 languages. Real capture of the demo running one week of simulated data.
How many walk by, how many walk in, and what share your storefront wins — the KPI Asian retail has measured for years.
Window, new arrivals, fitting rooms, till: where people stop and how long they stay.
From visitor to ticket: full funnel with revenue by hour and weekday.
Average wait per hour with alert threshold: open another till before the queue scares people off.
Sun, clouds or rain crossed with your real traffic: stop guessing, start correlating.
Tomorrow hour by hour, with an uncertainty band: staffing and stock matched to demand.
Every evening on your WhatsApp: the day's summary and what to expect tomorrow. No dashboard needed.
Using the camera you already have. Two clicks in a visual editor: nothing new to install.
A mini-PC inside the shop detects and follows each person. Video never leaves the premises — only anonymous events do.
Entries, capture, zones and forecast — on your phone, in your language, every day.
Setup planned in a single morning. 4-week pilot on your real data. No lock-in.
Book a demo in your shop